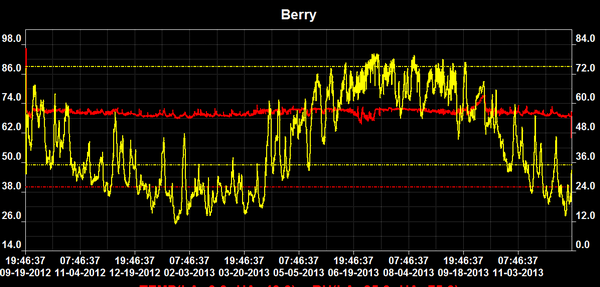
This graph shows the temperature (red line) and humidity (yellow line) for a period of over a year. This was taken in the sanctuary of North United Methodist Church in Indianapolis. Notice the overall sine wave up and down from winter to summer. Also notice the huge peaks that happen within a few days when the weather changes dramatically outside. All this is happening while the temperature stays very constant.